


Is the ceiling crashing on Bitcoin? Will this trading range break out... or break down?
Crypto Corner #355 | May 31 - June 6, 2025


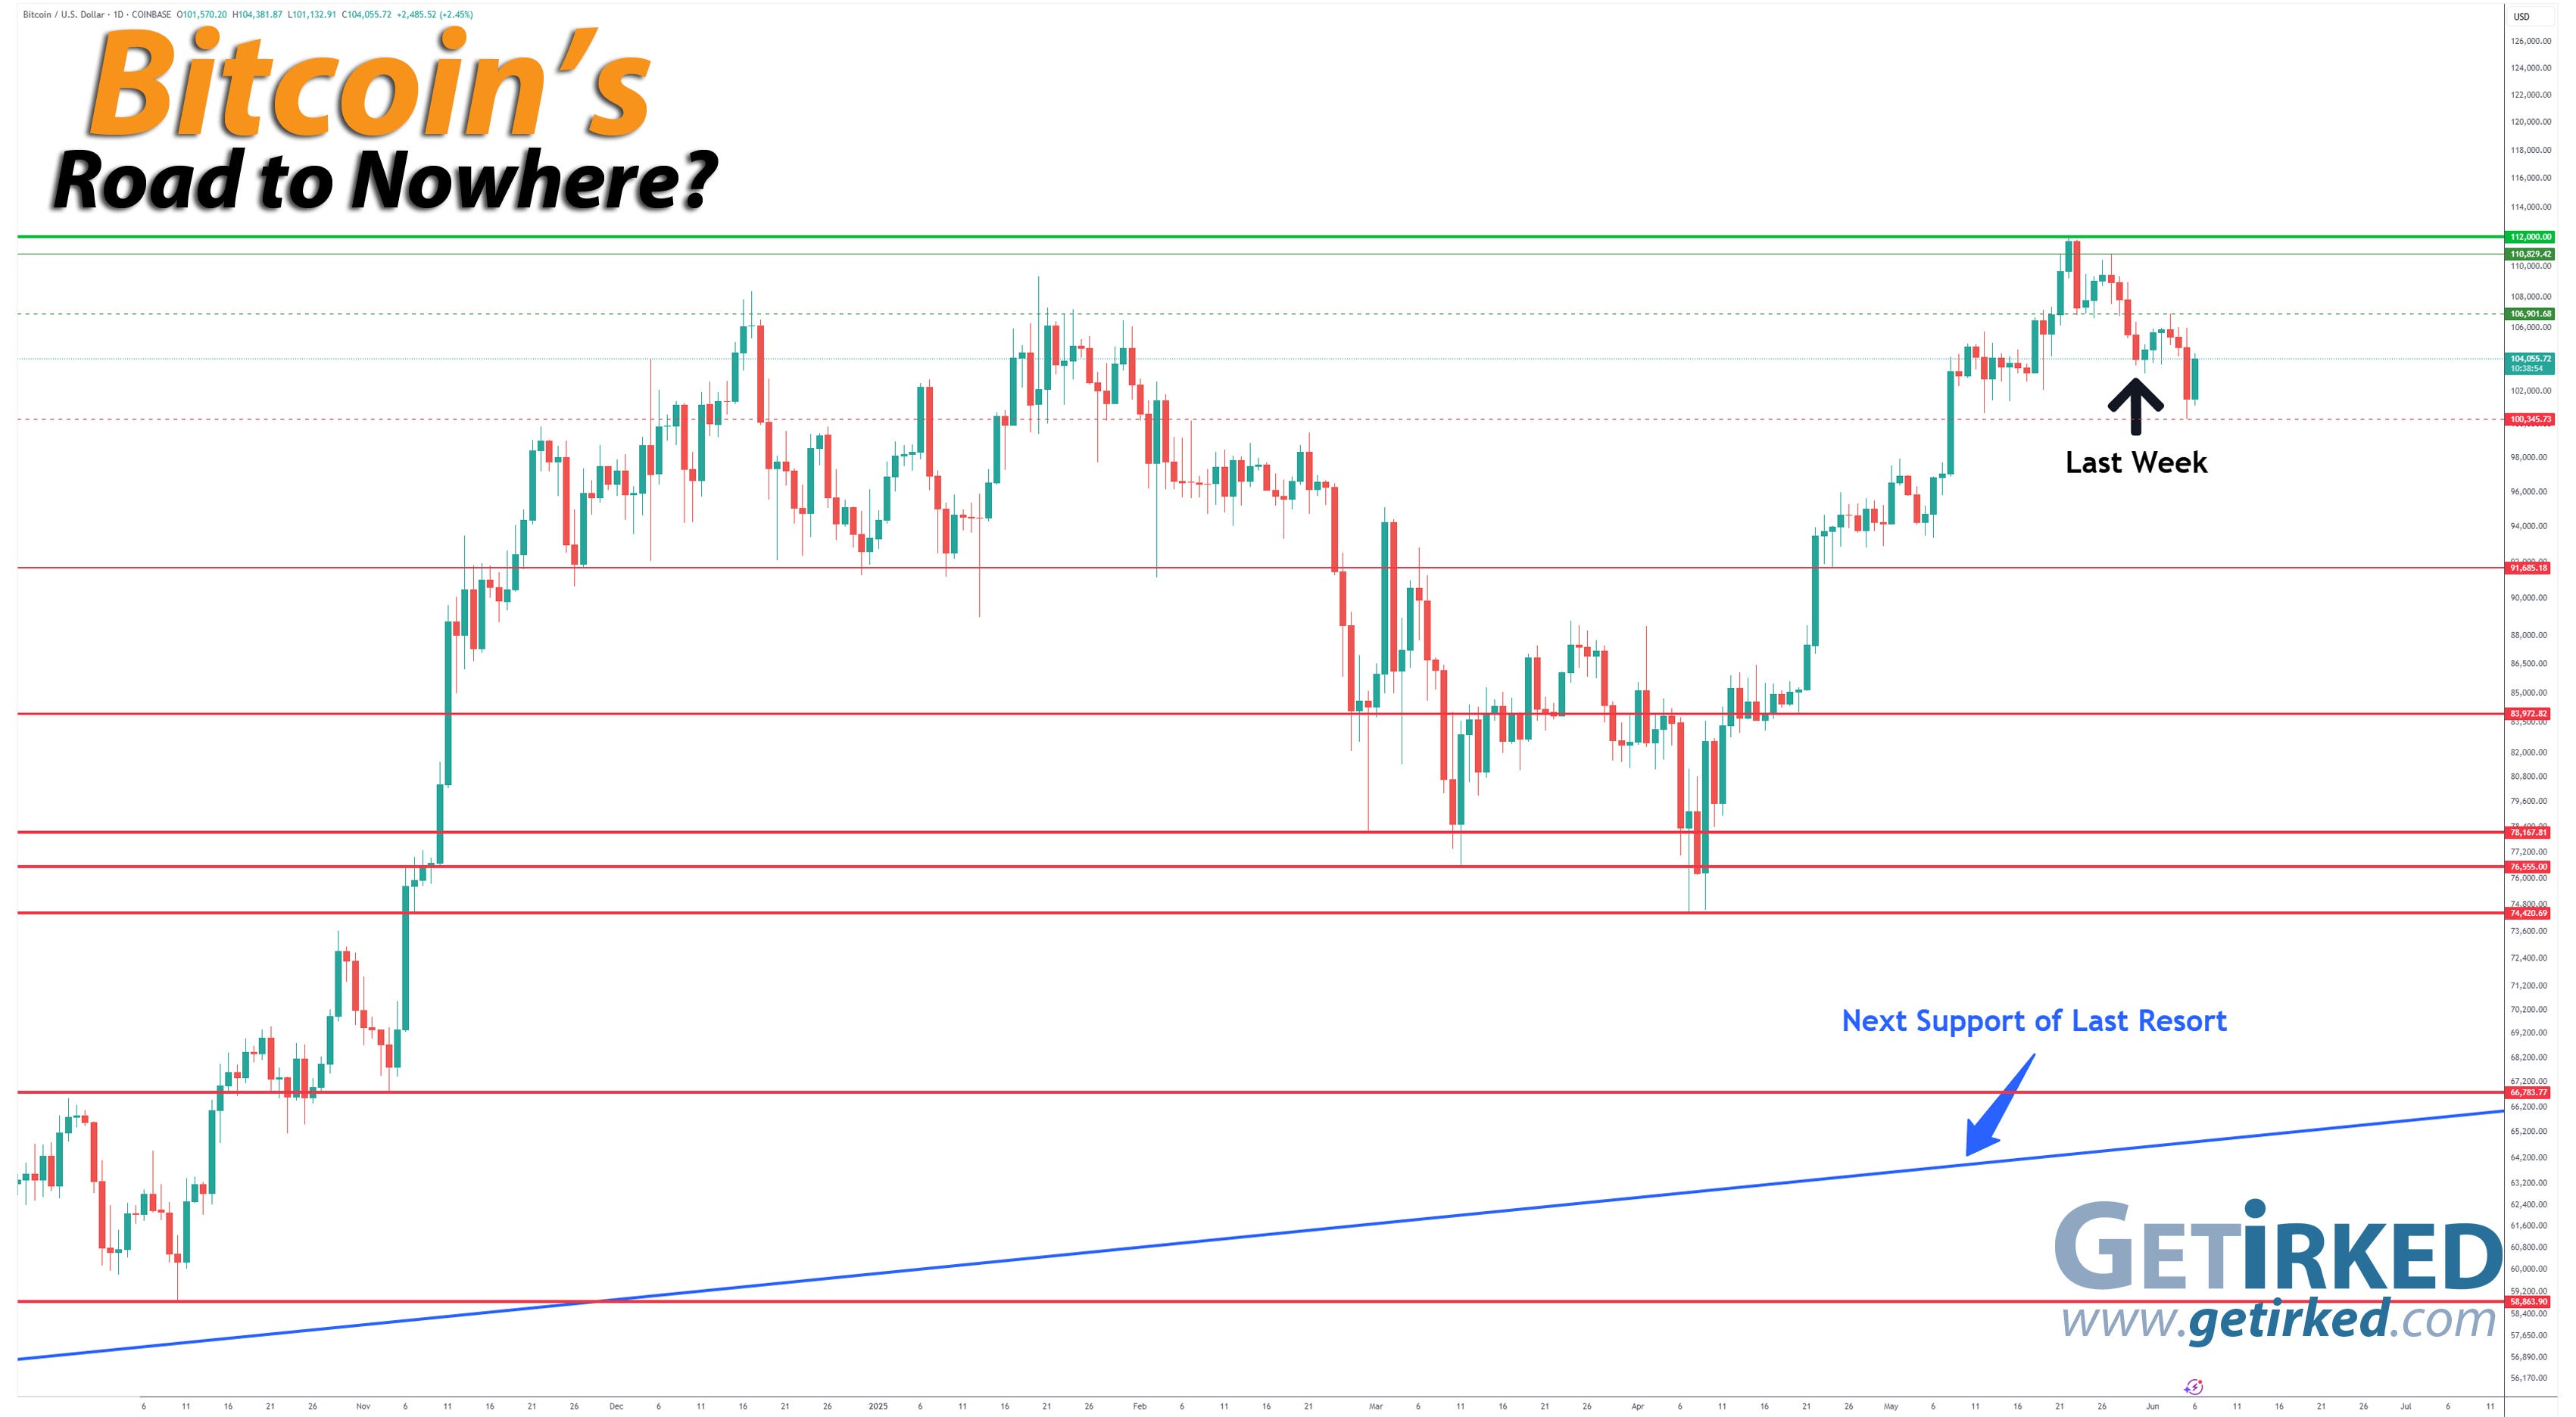
Bitcoin Price (in USD): $104,055.72
Weekly Change: -1.39%
Bitcoin Price Action
Bitcoin started to trade in a lower range this week. While it continues to strongly perform above the key psychological support at $100,000, Bitcoin did break down below last week’s low at $104,624.00. On Saturday, it fell through support and made a lower weekly-low at $103,110.01.
That bearish break continued with Bitcoin breaking through the next key support at $100,703.71 on Thursday and not finding a new weekly-low until $100,345.73 late Thursday evening.
The Bullish Case
Bulls argue that as long as Bitcoin remains above key support lines like the 50-Day Simple Moving Average (SMA), that all signs point to staying bullish. Some believe we’ll see Bitcoin achieve a higher all-time high before the end of June with the more bullish among them believing $125K and even higher is possible within the coming weeks.
The Bearish Case
Bears can always find a way to make lemons out of lemonade. Some Bears argue that since Bitcoin’s new all-time high was only 3.33% higher than its past high that it signifies a lack of buying interest. With no new buyers to add to the momentum, these Bears believe another substantial pullback of -20% or more is in store.
While I always take both sides into account, arguing that Bitcoin’s new all-time high wasn’t as “robust” as past breakouts seems a little crazy to me. Bitcoin rallied more than +50% from its April low to its new all time high in a matter of a six weeks. Of course there needs to be some price consolidation to digest a move like that!
However, if the Bears are right and Bitcoin is about to pull back significantly, readers know I will be there to buy the dip (or crash) with both hands!
Key Selloff Targets
Thanks to a new all-time high, I have updated all of the key selloff targets below. These key selloffs are derived from past pullbacks from all-time highs as well as various Crypto Winters:
-26.31% = $82,532.80
-30.27% = $78,097.60
-31.24% = $77,011.20
-31.95% = $76,216.00
-33.49% = $74,491.20
-37.63% = $69,854.40
-39.53% = $67,726.40
-40.24% = $66,931.20
-53.06% = $52,572.80
-62.91% = $41,540.80
-77.46% = $25,244.80
-84.36% = $17,516.80
Bitcoin Trade Update
Current Allocation: 6.500% (+14.70% since Last Update)
Current Per-Coin Price: $110,530.43 (-1.05% since Last Update)
Current Profit/Loss Status: -5.86% (-0.33% since Last Update)
It was time for more buying this week when Bitcoin pulled back below its prior weekly lows. I made a total of XX buys which left me with an average buy price of $103,188.95 (after trading fees). The buys lowered my per-coin cost -1.05% from $111,699.10 to $110,530.43 and raised my allocation +14.70% from 5.667% to %6.500.
As investors in any asset - but particularly Bitcoin and other crypto - it’s imperative to take advantage of volatility. However, my top priority will always remain risk management. While I will continue to add whenever Bitcoin tests (and retests) past support, I also make sure to keep plenty of dry powder on the sidelines in case we see another -30%, -50%, or even -90% drawdown.
It’s happened before and it can happen again! 😀👍
My Next 30 Bitcoin Buy Targets
Premium subscribers to Get Irked get access to my next thirty (30) … yes, 30 … buys in Bitcoin including price levels and quantities. Additionally, premium members get exclusive access to Microsoft Excel and Google Sheets version of my Bitcoin Trading Calculator.
I also include a tutorial video on how I execute my Trade2HODL strategy that I developed to accommodate crypto’s incredibly volatility after the 2018 crash which has never had a losing trade in more than 150+ trades since I started using it.
Keep reading with a 7-day free trial
Subscribe to Get Irked - Teaching Long-Term Investing Success to keep reading this post and get 7 days of free access to the full post archives.